Activating Magento Profiler and Debugging: An Eight-Step Guide

Activating Magento Profiler and Debugging: An Eight-Step Guide

Magento profiler is an internal PHP debugging tool. It permits you to gather data about controllers, actions, blocks, templates, events, etc. on different application execution stages. 

What is a Magento Profiler?

Magento debug permits you to get a report regarding how much time each feature or part of Magento is taking to load. This report gives you a fair idea about what is slowing down the site.

We will cover the following topics in the article:-

  1. Why And How To Use Magento Profiler?
  2. How To Enable Magento Profiler?
  3. What Do The Magento Profiler Results Mean?
  4. What If Profiler Output Is Not Visible On The Store Frontend?

Why and How to use Magento Profiler? 

Magento is one of the most popular platforms among e-commerce store owners as it covers all their needs and expectations. It has a wide variety of features and extensions to improve the performance and overall functionality of the site.

To use Magento Extensions and features o full extent, it is essential that servers are dedicated and powerful. But what if your Magento site takes a lot of time to load? Or you are not able to utilize all its features correctly. 

There can be many reasons behind the high load time of your e-commerce website such as:-

  • Incorrect Magento code profile
  • A rapid increase in web traffic
  • A lot of heavy files
  • Use of excessive plug-ins
  • Too many redirects
  • Server location
  • Server performance

Now, I want to emphasize a crucial point here. Server Performance can be one of the reasons behind the high load time of your page. Therefore, choosing the right server for your e-commerce website is very crucial. 

At YouDBox, we provide managed and dedicated servers for Magento Hosting. You don’t have to worry about an increase in load time of your site due to server performance anymore. We take care of that. 

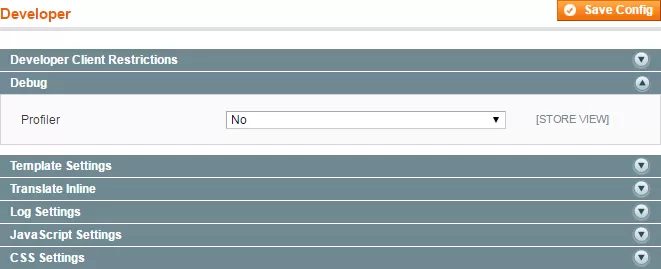
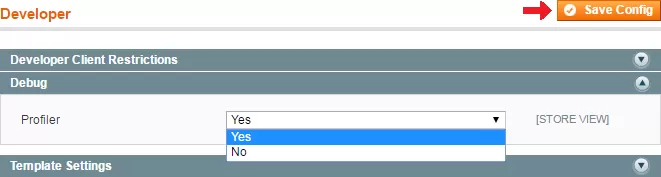
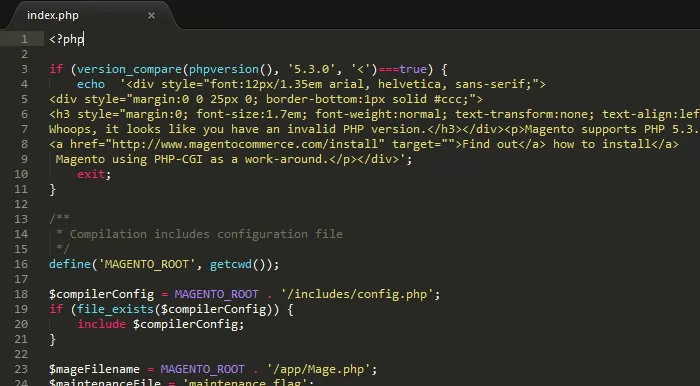
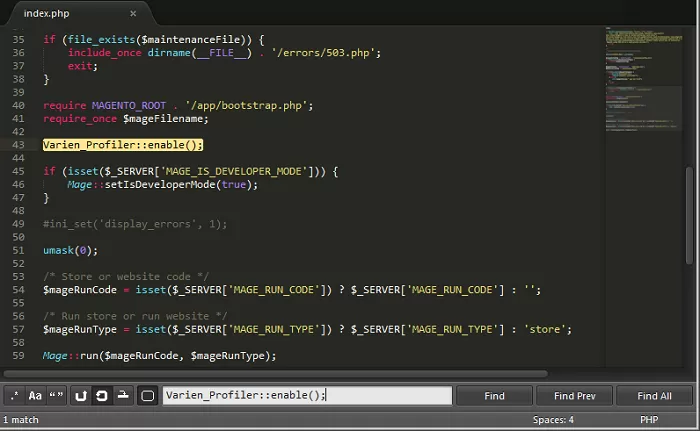
If there is a problem with Magento code, then you or your developer can solve it using PHP Profiler or Magento Debugger

Activating Magento Profiler and Debugging: An Eight-Step Guide image1

Points to be kept in mind before using Magento Varien:

  1. Magento debug mode should not be run on live sites as it gives complete info about how your page loads. Therefore, always run it in a development mode. 
  2. When you run code profiler, there will be an additional overhead as you will be initiating the execution of specific commands during loads.
  3. Using the profiler is very time consuming and requires in-depth technical knowledge. One wrong command can result in a huge problem.  
  4. You must try to solve front-end issues from your side. It helps in confirming the fact that the problem is really on the server-side.
  5. You can also check if the problem related to your database or not by logging into your MySQL account.
  6. Run show “process list.’’ If any query related to slow areas stay on the screen, you may have a database performance problem.
  7. Last but not least, check for faulty network or firewall connections. 

How to enable Magento Profiler?

Given below are the steps to enable Magento Profiler:-

1. Log in to your Magento Admin Panel.

Activating Magento Profiler and Debugging: An Eight-Step Guide image2

2. Go to System and choose Configuration. 

Activating Magento Profiler and Debugging: An Eight-Step Guide image3

3. Click on Magento Developer Toolbar under Advanced Menu

Activating Magento Profiler and Debugging: An Eight-Step Guide image4

4. Expand the Debug panel and set Profiler to Yes

Activating Magento Profiler and Debugging: An Eight-Step Guide image5

5. Click on Save Config button.  

Activating Magento Profiler and Debugging: An Eight-Step Guide image6

6. Open the index.php file in the root folder of Magneto.

Activating Magento Profiler and Debugging: An Eight-Step Guide image7

7. Search for #Varien_Profiler::enable(); 

Activating Magento Profiler and Debugging: An Eight-Step Guide image8

8. Uncomment it by removing #

Varien_Profiler::enable();

What do the Magento Profiler Results mean?

After you are done with all this, you will see the profiler output at the bottom of all Magento pages. It includes the following headers:-

  1. Code Profiler- Name of the block of the code.
  2. Time- The amount of time a block of the code took in execution. (in seconds).
  3. Cnt headers- The number of times it got executed.
  4. Emalloc- The amount of memory assigned by PHP for this particular action. (in bytes).
  5. RealMem- The amount of memory being used while rendering a particular Magento page.
Activating Magento Profiler and Debugging: An Eight-Step Guide image9

What if profiler output is not visible on the store frontend?

Despite enabling the profiler, in some cases the profiled data is not shown on the website pages. You can try doing a quick fix then, it may do the job for you:

Comment out the undermentioned code block in file app/code/core/Mage/Core/Block/Profiler.php 

if (!$this→_beforeToHtml() || !Mage::getStoreConfig('dev/debug/profiler') || !Mage::helper('core')→isDevAllowed()) {return ;}

I hope you find this article useful. If you have any questions, queries or feedback, then do not forget to comment below.

You can also Request A Call from us to know more about Managed Hosting For Magento.

More on this topic

Key Takeaways from Meet Magento Mumbai: India's Largest Magento Event

Key Takeaways from Meet Magento Mumbai: India's Largest Magento Event

The Leela Hotel of Mumbai was buzzing with excitement.

Measuring and Optimizing WordPress Network Latency for Better Speed

Measuring and Optimizing WordPress Network Latency for Better Speed

When it comes to improving the loading speed of the site, one must take care of every optimization that is possible.

Top Free Text Editors for Windows to Kickstart Coding

Top Free Text Editors for Windows to Kickstart Coding

Are you looking for the best text editor for Windows?

Don't miss this! Share this Article with your network!

© Copyright 2019 - 2024 YouDBox.site. All Rights Reserved.